For expert analysis of these results, we enlisted the help of Pet Boss Nation’s Candace D’Agnolo. She did own and operate three successful pet businesses, after all, before changing lanes to focus full-time on her equally successful pet business coaching company.
Based on the first six months of this year, how do you expect your total sales for 2023 to compare with 2022?
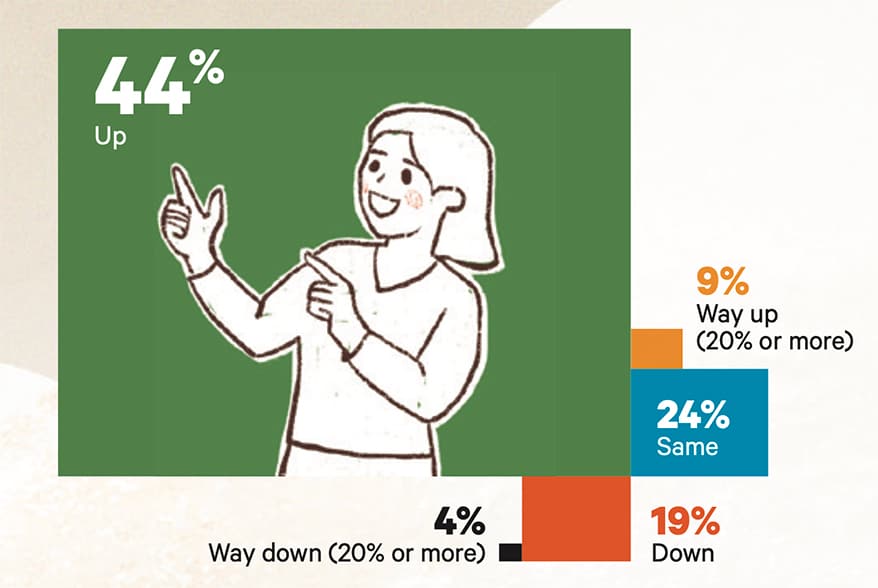
More than half of survey respondents expect to see growth year over year. That said, D’Agnolo adds cautious context to keep in mind when looking at these results and where you fall in them: “When tracking sales increases, take into consideration the price increases you’ve had to implement over that time period. If you raised prices 15% because your cost of those goods increased by that much, then the sales increase is due to that fact, not actually selling more or gaining market share.”
What were your total sales in 2022?
| Less than $250K |
|
21%
|
| $250K-$500K |
|
22%
|
$500K-$1M
|
|
25%
|
| $1M-$3.0M |
|
25%
|
| Greater than $3M |
|
7%
|
While revenue total depends on many factors and does not indicate financial health but rather a major revenue milestone, let’s take a moment to celebrate the seven-figure survey respondents — and those approaching that status. Very few small businesses ever reach this level!
What was your average retail sale per transaction in 2022?
| $40 or less |
|
21%
|
| $41-$50 |
|
18%
|
$51-$60
|
|
23%
|
| $61-$70 |
|
12%
|
| $71-$80 |
|
5%
|
| Greater than $80 |
|
8%
|
| I don’t calculate/track this. |
|
10%
|
| N/A |
|
3%
|
D’Agnolo was excited to see that so many of you track this number, but offers this advice: “Don’t stress if your average sale is lower than others because it’s like comparing Chihuahuas to Great Danes. So many factors go into this, like the type of shopper that comes into your store, and the types of products you sell and their price points. The most important thing is that you’re tracking it and can work to improve your number. The fastest way to grow your average sale is to try selling just one more $10 to $15 item to each customer.”
What were your average retail items per transaction in 2022?
| 1-2 |
|
15%
|
| 3-4 |
|
44%
|
5-6
|
|
13%
|
| 7-8 |
|
1%
|
| 9 or more |
|
1%
|
| I don’t calculate/track this. |
|
23%
|
| N/A |
|
3%
|
If you are among the 23% who do not track this number, D’Agnolo explains why you should: “This is a great statistic to fully understand your shoppers. It can help you know if there are more opportunities to improve, like with displays, customer walking flow, a different assortment, the product hitting at different moments of the customer’s experience … It also can tell you if people come in frequently or stock up while there. Like the average sale marker, it doesn’t matter how you compare to others, just work to get every customer to buy one more thing!”
If you are the owner, what did you earn (salary + share of profit) in 2022?
While we’re thrilled to see that the majority of you pull a paycheck, D’Agnolo sets this goal for 65% of you: “I’d like to see more owners taking home $75k or higher. You’re investing so much of your own personal time and money that you need to prioritize your own personal income from the business. Keep growing your revenue and profit so you can do this!”
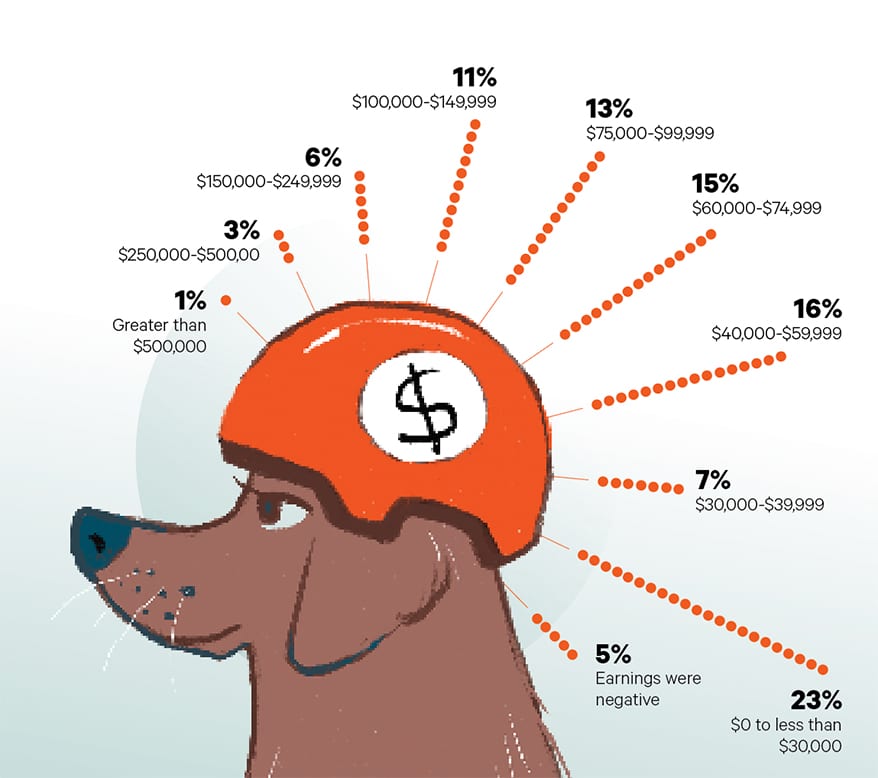
If you are the full-time top manager, what did you earn (salary + bonus) in 2022?
$0 to less than $30,000
|
|
19%
|
$30,000-$39,999
|
|
13%
|
| $40,000-$59,999 |
|
31%
|
$60,000-$74,999
|
|
18%
|
$75,000-$100,000
|
|
11%
|
Greater than $100,000
|
|
8%
|
For those owners offering less than $60,000 a year and struggling to retain quality top managers, look to the Hiring & Retention and Benefits, Pay & Perks sections for ideas on how your fellow indies are doing exactly that.
What was your average sales per square foot in 2022? (Total sales / total square footage)
| $100 or less |
|
6%
|
| $101-$299 |
|
13%
|
| $300-$499 |
|
10%
|
| $500-$699 |
|
5%
|
| $700-$1,000 |
|
4%
|
| Greater than $1,000 |
|
2%
|
| I don’t calculate/track this. |
|
53%
|
| N/A |
|
7%
|
More than half of you don’t prioritize this sales metric, but D’Agnolo points out that, “It helps you know how much you’re making within your space. A high sales per square foot tells you that you’re doing a lot well to maximize revenue — from product mix and price to displays and selling techniques.”
What was your average labor (excluding owner salary) to sales percentage in 2022? (Labor cost / sales x 100)
| 10% or less |
|
8%
|
| 11-15% |
|
11%
|
| 16-20% |
|
13%
|
| 21-25% |
|
7%
|
| Greater than 25% |
|
10%
|
| I don’t calculate/track this. |
|
39%
|
| N/A |
|
12%
|
To the 39% who don’t track this number, D’Agnolo says, “Spending too much on payroll can make or break you. For retailers, labor dollars should land between 16% to 20%. If you know you have enough staff and your labor percentage is less, then your team may be great salespeople! Perhaps it’s an opportunity to pay them more. If your retail labor costs are higher than 20%, you may have more people on the floor than you need or people who aren’t closing the sales!”
What was your overall margin on food in 2022?
| 30% or less |
|
29%
|
| 31-33% |
|
25%
|
| 34-35% |
|
14%
|
| 36-40% |
|
5%
|
| >40% |
|
4%
|
| I don’t calculate/track this. |
|
8%
|
| N/A |
|
15%
|
The high percentage of you selling at the lower margins indicates an attempt to compete on price with ecommerce, which D’Agnolo advises against: “You’ll never be the cheapest place to get something and shouldn’t be. There are lots of opportunities to play with your margins within the food category. One big one is to increase the margin on smaller bags or hard-to-find lines and go down gradually as the weight goes up. It may not work on every line of food you sell, but certainly worth a try!”
What was your overall margin on products other than food in 2022?
| 40% or less |
|
10%
|
| 41-45% |
|
9%
|
| 46-49% |
|
19%
|
| 50-53% |
|
28%
|
| 54-59% |
|
13%
|
| 60% or more |
|
9%
|
| I don’t calculate/track this. |
|
7%
|
| N/A |
|
5%
|
What % of your overall retail sales was from e-commerce in 2022?
| 1-10% |
|
35%
|
| 11-20% |
|
7%
|
| 21-30% |
|
3%
|
| 31-40% |
|
1%
|
| >40% |
|
1%
|
| N/A |
|
53%
|
More than half of respondents said they do not offer online sales. For you, D’Agnolo recommends making it a priority in 2024. “The responses from those who do have e-commerce sales shows that there is so much room for opportunity to still grow this sales channel. Consumer behavior is going to continue to drive there. Keep adapting as technology changes and keep learning how to drive traffic to your site and convert lookers into closed carts!”
Rank your services mix, from biggest generator of revenue to smallest: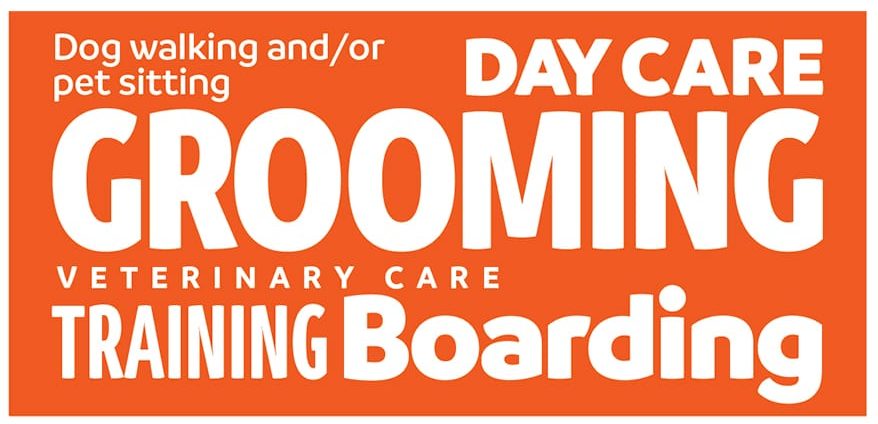
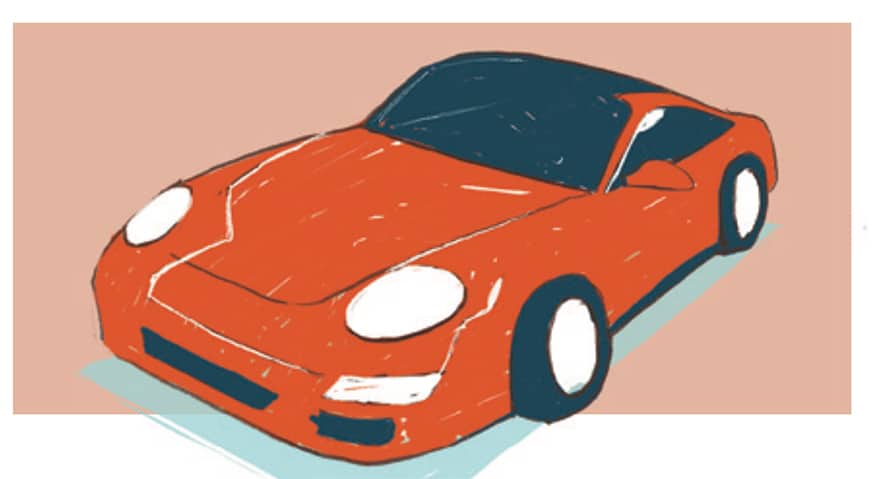
What make, model and year of automobile does your business most resemble — and why?

The answers to this question did not disappoint! They ranged from older cars and trucks that represent reliability to convertibles and vans that offer stylish fun to electric and hybrid vehicles that show a commitment to the environment. Some even crossed over! Here are a few of our favorite answers from vehicles mentioned most:
- ‘57 Chevy pickup, fully remodeled but rusted around the edges, with current-tech radio and navigation. We’re old school, but stay up on things.
- A 1999 Toyota 4Runner someone has painted, shined and replaced parts. We’ve withstood a lot, but we’re making updates and are always reliable. Community staple!
- Our flagship store resembles an older redone Volkswagen convertible that is whimsical and fun, both outside and inside! We have the longevity of 31 years, but the fun of the present day and the staying power of a vintage car!
- 1972 Volkswagen T2. This van was made for community! The friends, the dogs, the adventures. Totally us.
- Jeep Rubicon with the top off. Sometimes things get out of control, and sometimes money flies out, but we are reliable and have fun. + Restored and hybridized 1960’s Ford F-150. We are a back-to-basics kind of store that sells mostly single-ingredient treats in bulk bins, the necessary ingredients in complete meals, and the essentials for pets — but in a cool vibe atmosphere that focuses on sustainability.
- 2019 Mazda CX9. Reliable, a feeling of luxury without the price tag, safe/trustworthy with good ratings.
- 2023 Ram. Solid as a rock and always current.
- 2022 F-150 Tremor. We move through anything with effort and class.
- Toyota RAV4 Hybrid because we are thrifty and very efficient. + 2023 Chevrolet Colorado AT4. We are smaller than a lot of the “big trucks” out there, but we are strong, rugged, “fancy” and resilient!
- 2023 Subaru Outback. A little more expensive (still affordable) but fully functional, versatile and dependable!
- 2022 Toyota Tundra. Sleek looking and convenient. We make work look like it’s no big deal, though you will be hard pressed to find a vehicle that can give you as much bang for your buck. We do, however, cost a bunch to operate!
- 2023 Cadillac. Made in the USA, classy and safe.
- 2008 Porsche 911. We are compact but have a great selection, we are merchandised well, and our people are friendly and knowledgeable. We have been around a while and have some milage on us.
- Toyota Avalon. Reliable, utilitarian, but very dressed up. People always think that we will be pricey, but often comment about our great prices.
- Any 10-year-old SUV with third-row seating. We can take in quite a few boarding pets at one time (hence the size of an SUV), we have multiple kennel sizes to choose from (hence the varying seat sizes with a third-row seat option), and we’re working out of a building that was built in the ‘80s, but are continuously upgrading.
- 2020 Mercedes S class. Finely tuned, only have the best, not outrageously priced.
Broken down by percentage, what were your product sales by department in 2022?
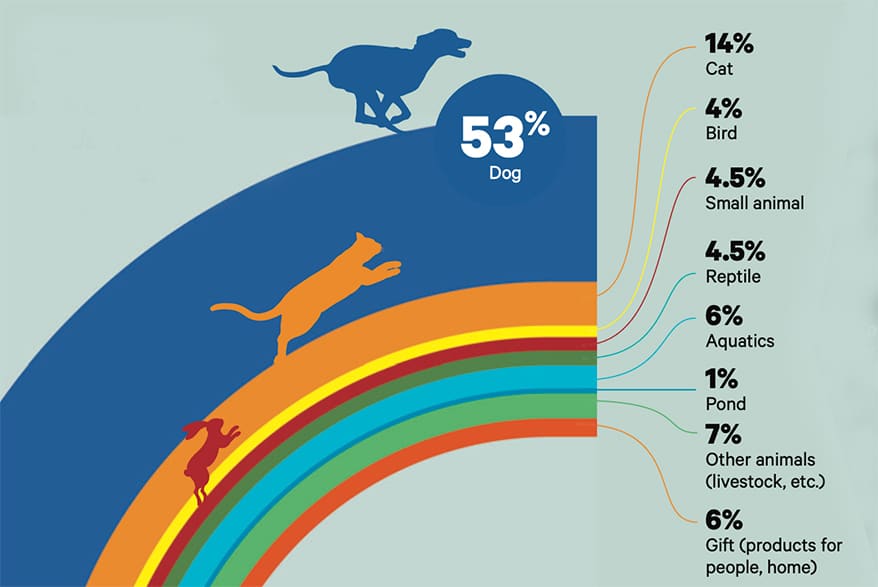
*Note: We excluded the 57% of respondents who answered N/A to the “product sales” question.
Other than dog and cat products, in which product category did you see the biggest sales growth in 2022?
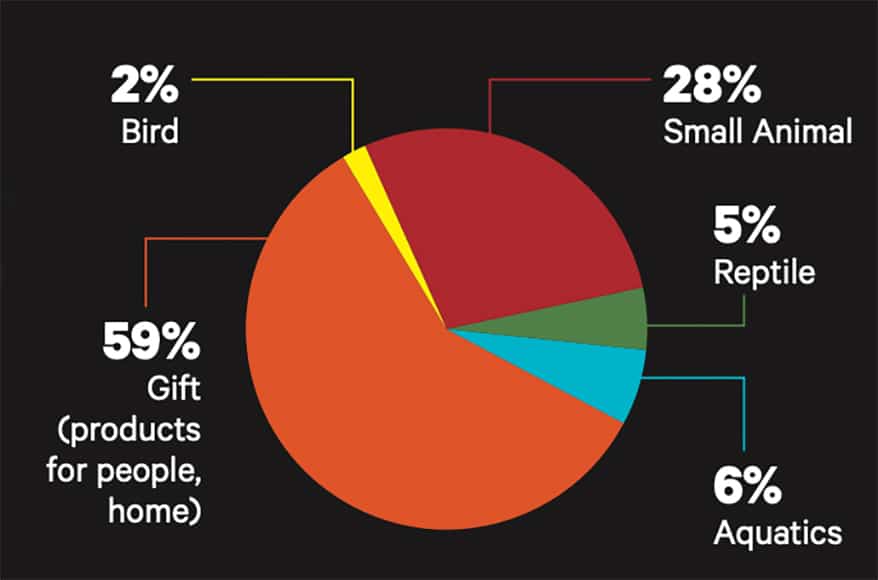
Important results to note here from these two questions: First, the gift category came in at a healthy 6% of total sales for 2022 and at the top for sales growth year over year. D’Agnolo explains why this presents an opportunity everyone should be taking advantage of: “The products in this department usually allow for a healthy and high margin. Plus, you can source products less likely to be found online and also easily private label these categories.”